![]()
MAKING THE WORLD VISIBLE:
INTERACTIVE VISUALIZATIONS OF KEY GLOBAL INDICATORS
DASHBOARDS
Dashboards are essential to the functioning of any vehicle, including the Earth. Dashboards show what is important. They should simplify, without being simplistic. They are tools for getting us from "here" to "there." More importantly, they help us clarify and define "there." To fulfil their core function, dashboards are tools for decision-making and action.
EARTH DASHBOARD
The Earth Dashboard was developed to perform four critical functions:
- Tell us where we are, right now
- Show us where we are heading
- Clarify where we want to be going (which is, in our case, invariably not where we are heading)
- Help us decide on a course of action— be that personal involvement at the local, regional or global level, or large-scale policy decisions at the national and global scale.
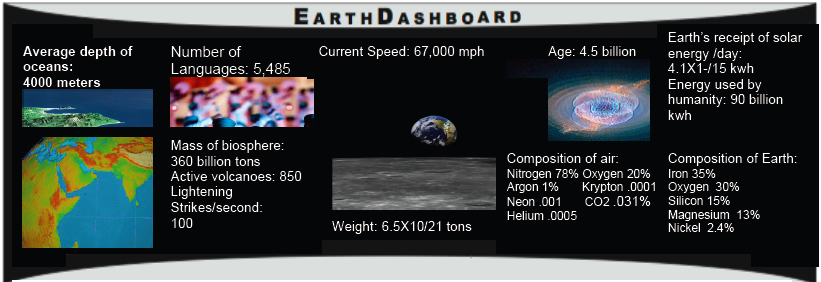
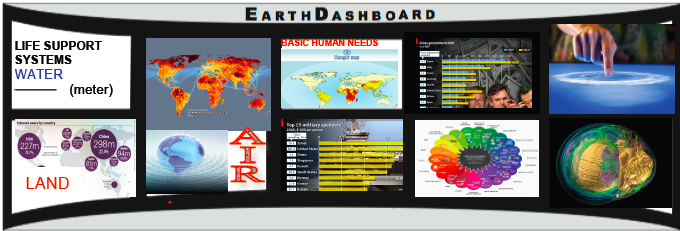
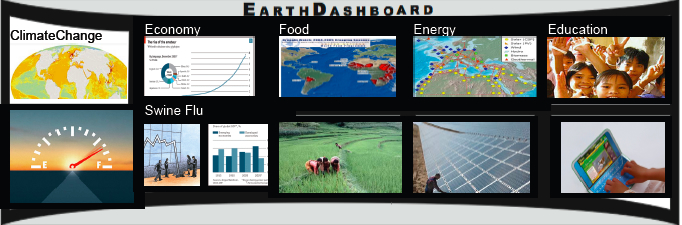
The Earth Dashboard presents a multifaceted perspective on the key indicators of the world. It does this through a series of real-time meters,
gauges, trends, maps, maps in time series, viability thermometers, and
alarms (among other data visualization techniques) that transform global
statistical information into creative information visualizations. Historical
data sets are intertwined with live feeds from web cams, satellite images,
and other streaming sources. This series of data display and visualization tools include worldometers showing what is happening right now; trends showing the past and short-term future (where we have been— the view out the rearview mirror, and the future we are heading towards— the view out the windshield); gauges showing remaining supplies or levels; maps showing geographical distributions; and the Learn More and Actions links that illustrate what we can do to align our vehicle's trajectory with where we want it to be going (the "steering wheel" controls of our vehicle).
The Earth Dashboard seeks to be a catalyst for changing identity from observer to designer. We are striving to be a dashboard for the Earth with a 1,000 year, as well as a 100, 10 year and right now perspective. The Earth Dashboard enables people from all around the
planet to understand and visualize the current state of the world we live
in. As a universal platform for making vital information accessible through
visualizations of key global indicators, it is designed
to bring a cross-cultural and interdisciplinary approach to generating
awareness and informed action worldwide.
There are currently three modalities of the Earth Dashboard: a web site, an interactive multimedia installation, and smart phone apps. The link to the prototype web site is here.
The multimedia installation is described below. Smart phone apps are under development. If you would like a brochure that describes the Earth Dashboard in more detail, you can download it here.
CRITICAL NEED
As the Knight Foundation puts it, "The world has always been complex, but we are now challenged with making sense of the rapidly increasing amounts of information that we are creating. According to IBM, nine-tenths of the world’s data has been created in the last two years. Cisco predicts that information generated by mobile devices will hit 130 exabytes in 2016 — that’s the equivalent of 520,000 Libraries of Congress in one year. A report from McKinsey anticipates that the amount of data we generate will increase 40% annually. Facebook users alone add a billion pieces of content every 24 hours."
“As data sits teetering between opportunity and crisis, we need people who can shift the scales and transform data into real assets.” — Roger Ehrenberg
As the world sits teetering between utopia and oblivion, as Buckminster Fuller would say, we need a tool that helps us make sense of the world, where we are, where we are heading and how to get there. The Earth Dashboard is intended as such a tool.
The world has a critical need to see itself as one interconnected whole
rather than disparate countries, cities, tribes, cultures, religions or
special interests. Without this unitary view of intertwined fates, the parochial trumps the planetary, narrow self-interest bests enlightened self-interest, greed beats cooperation and generosity— and the world is endangered through short-term and near-sighted thinking and actions.
Because of the interconnections of science, technology,
economy, culture, environment, problems and options— and the intertwined
fate of all life on-board “Spaceship Earth,” there is an urgent need for
a tool similar in purpose and function to a vehicle’s dashboard. The Earth
Dashboard benefits and empowers people by enabling everyone to have access to an easy-to-understand current
condition report of their “ship’s” resources, problems, solutions, crew,
and passengers.
“A dashboard is a visual display of the most important information needed
to achieve one or more objectives; consolidated and arranged on a single
screen so the information can be monitored at a glance.” —Stephen Few, Information Dashboard Design
“There is too much data and not enough information.”
As
the world becomes more interdependent and complex the need for tools that
transform seemingly overwhelming complexity into understandable knowledge—without
over-simplification or trivialization—increase in importance. A
data visualization tool is needed to help government leaders, policy makers,
educators, executives, the media and general public see and quickly understand
the world as a whole system—where our well-being and fate are interlinked—and
not to be overwhelmed by the ever increasing multiplication of data.
Dashboards are essential tools for piloting any vehicle more complicated
than a lawnmower. They provide critical information needed for the effective
operation of the vehicle. Spaceship Earth—the most complicated vehicle
we know of—needs a dashboard for the same reasons a car needs one.
The people of the world need a dashboard to access the condition of their
vehicle and to learn as quickly as possible of any troubles that could
compromise the vehicle’s continuing viability. Does it have enough
fuel to get us to where we want to be going? Is the vehicle overheating?
Are needs going unmet? Are there warning lights alerting us to dangerous
conditions? Is everything working properly?
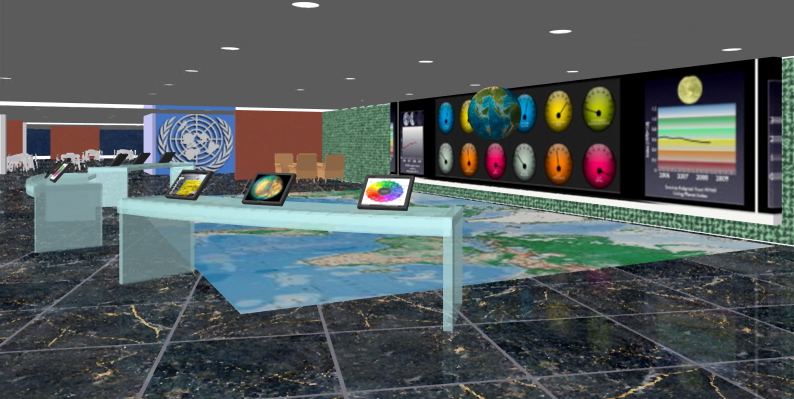
EARTH DASHBOARD MULTIMEDIA INSTALLATION
The first Earth Dashboard multimedia installation will be at the United Nations in New York. This version of the Earth Dashboard will premier at the United Nations Headquarters Visitors’ Lobby in New York as an installation that will be seen and experienced by over one million international visitors per year, ranging from world leaders to students and the general public.
It will provide an unprecedented experience that adds new
perspectives and transparency to critical information about our planet’s
predicament and sustainability—all displayed on a large-scale
video wall measuring 10m x 2m (33 feet by 6 feet).
The Earth Dashboard is a project of EarthGame™ a non-profit tax-exempt research and education organization whose mission is to build the EarthGame and it's associated set of tools for global and local problem recognition, definition and solution. The Earth Dashboard is its core focus. EarthGame, Inc. is located in the Philadelphia, Pennsylvania area of the United States and can be reached at 610.506.7176 or info@1earthgame.org. If you would like a brochure that describes the Earth Dashboard, you can download it here. For more information on the Earth Dashboard, our team, our needs, development pathway, and how you can get involve, see here.
Contact: info@1earthgame.org